Support Vector Machines
Contents
12. Support Vector Machines
12.1. Introduction
A Support Vector Machine (SVM) is a very powerful and versatile Machine Learning method, capable of performing linear or nonlinear classification, regression, and even outlier detection. It is one of the most popular models in Machine Learning, and anyone interested in Machine Learning should have it in their toolbox. SVMs are particularly well suited for classification of complex but small-sized or medium-sized datasets.
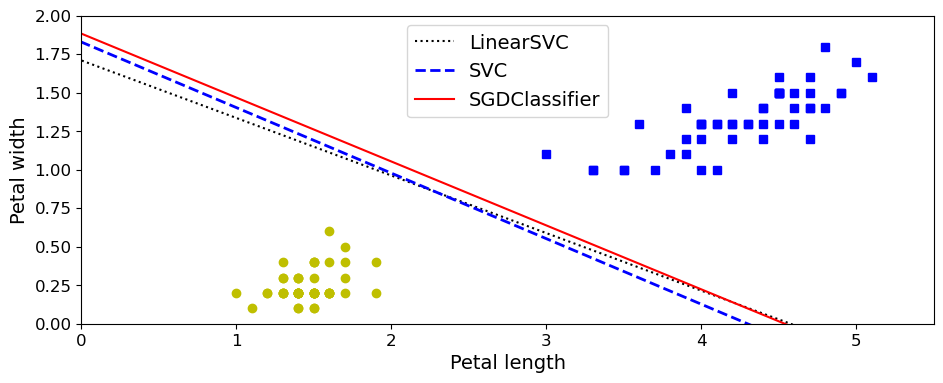
The case with two well-separated classes only can be understood in an intuitive way in terms of lines in a two-dimensional space separating the two classes (see figure below).
The basic mathematics behind the SVM is however less familiar to most of us. It relies on the definition of hyperplanes and the definition of a margin which separates classes (in case of classification problems) of variables. It is also used for regression problems.
With SVMs we distinguish between hard margin and soft margins. The latter introduces a so-called softening parameter to be discussed below. We distinguish also between linear and non-linear approaches. The latter are the most frequent ones since it is rather unlikely that we can separate classes easily by say straight lines.
12.2. Hyperplanes and all that
The theory behind support vector machines (SVM hereafter) is based on the mathematical description of so-called hyperplanes. Let us start with a two-dimensional case. This will also allow us to introduce our first SVM examples. These will be tailored to the case of two specific classes, as displayed in the figure here based on the usage of the petal data.
We assume here that our data set can be well separated into two domains, where a straight line does the job in the separating the two classes. Here the two classes are represented by either squares or circles.
%matplotlib inline

from sklearn import datasets
from sklearn.svm import SVC, LinearSVC
from sklearn.linear_model import SGDClassifier
from sklearn.preprocessing import StandardScaler
import matplotlib
import matplotlib.pyplot as plt
plt.rcParams['axes.labelsize'] = 14
plt.rcParams['xtick.labelsize'] = 12
plt.rcParams['ytick.labelsize'] = 12


iris = datasets.load_iris()
X = iris["data"][:, (2, 3)]  # petal length, petal width
y = iris["target"]

setosa_or_versicolor = (y == 0) | (y == 1)
X = X[setosa_or_versicolor]
y = y[setosa_or_versicolor]


C = 5
alpha = 1 / (C * len(X))

lin_clf = LinearSVC(loss="hinge", C=C, random_state=42)
svm_clf = SVC(kernel="linear", C=C)
sgd_clf = SGDClassifier(loss="hinge", learning_rate="constant", eta0=0.001, alpha=alpha,
                        max_iter=100000, random_state=42)

scaler = StandardScaler()
X_scaled = scaler.fit_transform(X)

lin_clf.fit(X_scaled, y)
svm_clf.fit(X_scaled, y)
sgd_clf.fit(X_scaled, y)

print("LinearSVC:                   ", lin_clf.intercept_, lin_clf.coef_)
print("SVC:                         ", svm_clf.intercept_, svm_clf.coef_)
print("SGDClassifier(alpha={:.5f}):".format(sgd_clf.alpha), sgd_clf.intercept_, sgd_clf.coef_)

# Compute the slope and bias of each decision boundary
w1 = -lin_clf.coef_[0, 0]/lin_clf.coef_[0, 1]
b1 = -lin_clf.intercept_[0]/lin_clf.coef_[0, 1]
w2 = -svm_clf.coef_[0, 0]/svm_clf.coef_[0, 1]
b2 = -svm_clf.intercept_[0]/svm_clf.coef_[0, 1]
w3 = -sgd_clf.coef_[0, 0]/sgd_clf.coef_[0, 1]
b3 = -sgd_clf.intercept_[0]/sgd_clf.coef_[0, 1]

# Transform the decision boundary lines back to the original scale
line1 = scaler.inverse_transform([[-10, -10 * w1 + b1], [10, 10 * w1 + b1]])
line2 = scaler.inverse_transform([[-10, -10 * w2 + b2], [10, 10 * w2 + b2]])
line3 = scaler.inverse_transform([[-10, -10 * w3 + b3], [10, 10 * w3 + b3]])

# Plot all three decision boundaries
plt.figure(figsize=(11, 4))
plt.plot(line1[:, 0], line1[:, 1], "k:", label="LinearSVC")
plt.plot(line2[:, 0], line2[:, 1], "b--", linewidth=2, label="SVC")
plt.plot(line3[:, 0], line3[:, 1], "r-", label="SGDClassifier")
plt.plot(X[:, 0][y==1], X[:, 1][y==1], "bs") # label="Iris-Versicolor"
plt.plot(X[:, 0][y==0], X[:, 1][y==0], "yo") # label="Iris-Setosa"
plt.xlabel("Petal length", fontsize=14)
plt.ylabel("Petal width", fontsize=14)
plt.legend(loc="upper center", fontsize=14)
plt.axis([0, 5.5, 0, 2])

plt.show()
LinearSVC:                    [0.28475098] [[1.05364854 1.09903804]]
SVC:                          [0.31896852] [[1.1203284  1.02625193]]
SGDClassifier(alpha=0.00200): [0.117] [[0.77714169 0.72981762]]
12.2.1. What is a hyperplane?
The aim of the SVM algorithm is to find a hyperplane in a \(p\)-dimensional space, where \(p\) is the number of features that distinctly classifies the data points.
In a \(p\)-dimensional space, a hyperplane is what we call an affine subspace of dimension of \(p-1\). As an example, in two dimension, a hyperplane is simply as straight line while in three dimensions it is a two-dimensional subspace, or stated simply, a plane.
In two dimensions, with the variables \(x_1\) and \(x_2\), the hyperplane is defined as
where \(b\) is the intercept and \(w_1\) and \(w_2\) define the elements of a vector orthogonal to the line \(b+w_1x_1+w_2x_2=0\). In two dimensions we define the vectors \(\boldsymbol{x} =[x1,x2]\) and \(\boldsymbol{w}=[w1,w2]\). We can then rewrite the above equation as
We limit ourselves to two classes of outputs \(y_i\) and assign these classes the values \(y_i = \pm 1\). In a \(p\)-dimensional space of say \(p\) features we have a hyperplane defines as
If we define a matrix \(\boldsymbol{X}=\left[\boldsymbol{x}_1,\boldsymbol{x}_2,\dots, \boldsymbol{x}_p\right]\) of dimension \(n\times p\), where \(n\) represents the observations for each feature and each vector \(x_i\) is a column vector of the matrix \(\boldsymbol{X}\),
If the above condition is not met for a given vector \(\boldsymbol{x}_i\) we have
if our output \(y_i=1\). In this case we say that \(\boldsymbol{x}_i\) lies on one of the sides of the hyperplane and if
for the class of observations \(y_i=-1\), then \(\boldsymbol{x}_i\) lies on the other side.
Equivalently, for the two classes of observations we have
When we try to separate hyperplanes, if it exists, we can use it to construct a natural classifier: a test observation is assigned a given class depending on which side of the hyperplane it is located.
12.3. The two-dimensional case
Let us try to develop our intuition about SVMs by limiting ourselves to a two-dimensional
plane. To separate the two classes of data points, there are many
possible lines (hyperplanes if you prefer a more strict naming)
that could be chosen. Our objective is to find a
plane that has the maximum margin, i.e the maximum distance between
data points of both classes. Maximizing the margin distance provides
some reinforcement so that future data points can be classified with
more confidence.
What a linear classifier attempts to accomplish is to split the feature space into two half spaces by placing a hyperplane between the data points. This hyperplane will be our decision boundary. All points on one side of the plane will belong to class one and all points on the other side of the plane will belong to the second class two.
Unfortunately there are many ways in which we can place a hyperplane to divide the data. Below is an example of two candidate hyperplanes for our data sample.
Let us define the function
as the function that determines the line \(L\) that separates two classes (our two features), see the figure here.
Any point defined by \(\boldsymbol{x}_i\) and \(\boldsymbol{x}_2\) on the line \(L\) will satisfy \(\boldsymbol{w}^T(\boldsymbol{x}_1-\boldsymbol{x}_2)=0\).
The signed distance \(\delta\) from any point defined by a vector \(\boldsymbol{x}\) and a point \(\boldsymbol{x}_0\) on the line \(L\) is then
How do we find the parameter \(b\) and the vector \(\boldsymbol{w}\)? What we could do is to define a cost function which now contains the set of all misclassified points \(M\) and attempt to minimize this function
We could now for example define all values \(y_i =1\) as misclassified in case we have \(\boldsymbol{w}^T\boldsymbol{x}_i+b < 0\) and the opposite if we have \(y_i=-1\). Taking the derivatives gives us
and
We can now use the Newton-Raphson method or different variants of the gradient descent family (from plain gradient descent to various stochastic gradient descent approaches) to solve the equations
and
where \(\eta\) is our by now well-known learning rate.
The equations we discussed above can be coded rather easily (the framework is similar to what we developed for logistic regression). We are going to set up a simple case with two classes only and we want to find a line which separates them the best possible way.
There are however problems with this approach, although it looks pretty straightforward to implement. When running the above code, we see that we can easily end up with many diffeent lines which separate the two classes.
For small gaps between the entries, we may also end up needing many iterations before the solutions converge and if the data cannot be separated properly into two distinct classes, we may not experience a converge at all.
12.4. A better approach
A better approach is rather to try to define a large margin between the two classes (if they are well separated from the beginning).
Thus, we wish to find a margin \(M\) with \(\boldsymbol{w}\) normalized to \(\vert\vert \boldsymbol{w}\vert\vert =1\) subject to the condition
All points are thus at a signed distance from the decision boundary defined by the line \(L\). The parameters \(b\) and \(w_1\) and \(w_2\) define this line.
We seek thus the largest value \(M\) defined by
or just
If we scale the equation so that \(\vert \vert \boldsymbol{w}\vert\vert = 1/M\), we have to find the minimum of \(\boldsymbol{w}^T\boldsymbol{w}=\vert \vert \boldsymbol{w}\vert\vert\) (the norm) subject to the condition
We have thus defined our margin as the invers of the norm of \(\boldsymbol{w}\). We want to minimize the norm in order to have a as large as possible margin \(M\). Before we proceed, we need to remind ourselves about Lagrangian multipliers.
Consider a function of three independent variables \(f(x,y,z)\) . For the function \(f\) to be an extreme we have
A necessary and sufficient condition is
due to
In many problems the variables \(x,y,z\) are often subject to constraints (such as those above for the margin) so that they are no longer all independent. It is possible at least in principle to use each constraint to eliminate one variable and to proceed with a new and smaller set of independent varables.
The use of so-called Lagrangian multipliers is an alternative technique when the elimination of variables is incovenient or undesirable. Assume that we have an equation of constraint on the variables \(x,y,z\)
resulting in
Now we cannot set anymore
if \(df=0\) is wanted because there are now only two independent variables! Assume \(x\) and \(y\) are the independent variables. Then \(dz\) is no longer arbitrary.
However, we can add to
a multiplum of \(d\phi\), viz. \(\lambda d\phi\), resulting in
Our multiplier is chosen so that
We need to remember that we took \(dx\) and \(dy\) to be arbitrary and thus we must have
and
When all these equations are satisfied, \(df=0\). We have four unknowns, \(x,y,z\) and \(\lambda\). Actually we want only \(x,y,z\), \(\lambda\) needs not to be determined, it is therefore often called Lagrange’s undetermined multiplier. If we have a set of constraints \(\phi_k\) we have the equations
In order to solve the above problem, we define the following Lagrangian function to be minimized
where \(\lambda_i\) is a so-called Lagrange multiplier subject to the condition \(\lambda_i \geq 0\).
Taking the derivatives with respect to \(b\) and \(\boldsymbol{w}\) we obtain
and
Inserting these constraints into the equation for \({\cal L}\) we obtain
subject to the constraints \(\lambda_i\geq 0\) and \(\sum_i\lambda_iy_i=0\). We must in addition satisfy the Karush-Kuhn-Tucker (KKT) condition
If \(\lambda_i > 0\), then \(y_i(\boldsymbol{w}^T\boldsymbol{x}_i+b)=1\) and we say that \(x_i\) is on the boundary.
If \(y_i(\boldsymbol{w}^T\boldsymbol{x}_i+b)> 1\), we say \(x_i\) is not on the boundary and we set \(\lambda_i=0\).
When \(\lambda_i > 0\), the vectors \(\boldsymbol{x}_i\) are called support vectors. They are the vectors closest to the line (or hyperplane) and define the margin \(M\).
We can rewrite
and its constraints in terms of a matrix-vector problem where we minimize w.r.t. \(\lambda\) the following problem
subject to \(\boldsymbol{y}^T\boldsymbol{\lambda}=0\). Here we defined the vectors \(\boldsymbol{\lambda} =[\lambda_1,\lambda_2,\dots,\lambda_n]\) and \(\boldsymbol{y}=[y_1,y_2,\dots,y_n]\).
Solving the above problem, yields the values of \(\lambda_i\). To find the coefficients of your hyperplane we need simply to compute
With our vector \(\boldsymbol{w}\) we can in turn find the value of the intercept \(b\) (here in two dimensions) via
resulting in
or if we write it out in terms of the support vectors only, with \(N_s\) being their number, we have
With our hyperplane coefficients we can use our classifier to assign any observation by simply using
Below we discuss how to find the optimal values of \(\lambda_i\). Before we proceed however, we discuss now the so-called soft classifier.
12.5. A soft classifier
Till now, the margin is strictly defined by the support vectors. This defines what is called a hard classifier, that is the margins are well defined.
Suppose now that classes overlap in feature space, as shown in the figure here. One way to deal with this problem before we define the so-called kernel approach, is to allow a kind of slack in the sense that we allow some points to be on the wrong side of the margin.
We introduce thus the so-called slack variables \(\boldsymbol{\xi} =[\xi_1,x_2,\dots,x_n]\) and modify our previous equation
to
with the requirement \(\xi_i\geq 0\). The total violation is now \(\sum_i\xi\). The value \(\xi_i\) in the constraint the last constraint corresponds to the amount by which the prediction \(y_i(\boldsymbol{w}^T\boldsymbol{x}_i+b)=1\) is on the wrong side of its margin. Hence by bounding the sum \(\sum_i \xi_i\), we bound the total amount by which predictions fall on the wrong side of their margins.
Misclassifications occur when \(\xi_i > 1\). Thus bounding the total sum by some value \(C\) bounds in turn the total number of misclassifications.
This has in turn the consequences that we change our optmization problem to finding the minimum of
subject to
with the requirement \(\xi_i\geq 0\).
Taking the derivatives with respect to \(b\) and \(\boldsymbol{w}\) we obtain
and
and
Inserting these constraints into the equation for \({\cal L}\) we obtain the same equation as before
but now subject to the constraints \(\lambda_i\geq 0\), \(\sum_i\lambda_iy_i=0\) and \(0\leq\lambda_i \leq C\). We must in addition satisfy the Karush-Kuhn-Tucker condition which now reads
5 0
< < < ! ! M A T H _ B L O C K
and
12.6. Kernels and non-linearity
The cases we have studied till now, were all characterized by two classes with a close to linear separability. The classifiers we have described so far find linear boundaries in our input feature space. It is possible to make our procedure more flexible by exploring the feature space using other basis expansions such as higher-order polynomials, wavelets, splines etc.
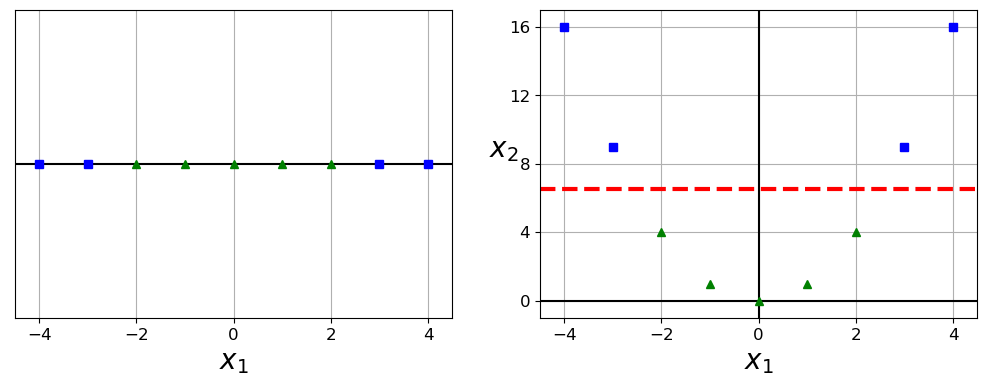
If our feature space is not easy to separate, as shown in the figure here, we can achieve a better separation by introducing more complex basis functions. The ideal would be, as shown in the next figure, to, via a specific transformation to obtain a separation between the classes which is almost linear.
The change of basis, from \(x\rightarrow z=\phi(x)\) leads to the same type of equations to be solved, except that we need to introduce for example a polynomial transformation to a two-dimensional training set.
import numpy as np
import os

np.random.seed(42)

# To plot pretty figures
import matplotlib
import matplotlib.pyplot as plt
plt.rcParams['axes.labelsize'] = 14
plt.rcParams['xtick.labelsize'] = 12
plt.rcParams['ytick.labelsize'] = 12


from sklearn.svm import SVC
from sklearn import datasets


X1D = np.linspace(-4, 4, 9).reshape(-1, 1)
X2D = np.c_[X1D, X1D**2]
y = np.array([0, 0, 1, 1, 1, 1, 1, 0, 0])

plt.figure(figsize=(11, 4))

plt.subplot(121)
plt.grid(True, which='both')
plt.axhline(y=0, color='k')
plt.plot(X1D[:, 0][y==0], np.zeros(4), "bs")
plt.plot(X1D[:, 0][y==1], np.zeros(5), "g^")
plt.gca().get_yaxis().set_ticks([])
plt.xlabel(r"$x_1$", fontsize=20)
plt.axis([-4.5, 4.5, -0.2, 0.2])

plt.subplot(122)
plt.grid(True, which='both')
plt.axhline(y=0, color='k')
plt.axvline(x=0, color='k')
plt.plot(X2D[:, 0][y==0], X2D[:, 1][y==0], "bs")
plt.plot(X2D[:, 0][y==1], X2D[:, 1][y==1], "g^")
plt.xlabel(r"$x_1$", fontsize=20)
plt.ylabel(r"$x_2$", fontsize=20, rotation=0)
plt.gca().get_yaxis().set_ticks([0, 4, 8, 12, 16])
plt.plot([-4.5, 4.5], [6.5, 6.5], "r--", linewidth=3)
plt.axis([-4.5, 4.5, -1, 17])
plt.subplots_adjust(right=1)
plt.show()
Suppose we define a polynomial transformation of degree two only (we continue to live in a plane with \(x_i\) and \(y_i\) as variables)
With our new basis, the equations we solved earlier are basically the same, that is we have now (without the slack option for simplicity)
subject to the constraints \(\lambda_i\geq 0\), \(\sum_i\lambda_iy_i=0\), and for the support vectors
from which we also find \(b\). To compute \(\boldsymbol{z}_i^T\boldsymbol{z}_j\) we define the kernel \(K(\boldsymbol{x}_i,\boldsymbol{x}_j)\) as
For the above example, the kernel reads
We note that this is nothing but the dot product of the two original vectors \((\boldsymbol{x}_i^T\boldsymbol{x}_j)^2\). Instead of thus computing the product in the Lagrangian of \(\boldsymbol{z}_i^T\boldsymbol{z}_j\) we simply compute the dot product \((\boldsymbol{x}_i^T\boldsymbol{x}_j)^2\).
This leads to the so-called kernel trick and the result leads to the same as if we went through the trouble of performing the transformation \(\phi(\boldsymbol{x}_i)^T\phi(\boldsymbol{x}_j)\) during the SVM calculations.
Using our definition of the kernel We can rewrite again the Lagrangian
subject to the constraints \(\lambda_i\geq 0\), \(\sum_i\lambda_iy_i=0\) in terms of a convex optimization problem
subject to \(\boldsymbol{y}^T\boldsymbol{\lambda}=0\). Here we defined the vectors \(\boldsymbol{\lambda} =[\lambda_1,\lambda_2,\dots,\lambda_n]\) and \(\boldsymbol{y}=[y_1,y_2,\dots,y_n]\). If we add the slack constants this leads to the additional constraint \(0\leq \lambda_i \leq C\).
We can rewrite this (see the solutions below) in terms of a convex optimization problem of the type
Below we discuss how to solve these equations. Here we note that the matrix \(\boldsymbol{P}\) has matrix elements \(p_{ij}=y_iy_jK(\boldsymbol{x}_i,\boldsymbol{x}_j)\). Given a kernel \(K\) and the targets \(y_i\) this matrix is easy to set up. The constraint \(\boldsymbol{y}^T\boldsymbol{\lambda}=0\) leads to \(f=0\) and \(\boldsymbol{A}=\boldsymbol{y}\). How to set up the matrix \(\boldsymbol{G}\) is discussed later. Here note that the inequalities \(0\leq \lambda_i \leq C\) can be split up into \(0\leq \lambda_i\) and \(\lambda_i \leq C\). These two inequalities define then the matrix \(\boldsymbol{G}\) and the vector \(\boldsymbol{h}\).
12.7. Different kernels and Mercer’s theorem
There are several popular kernels being used. These are
Linear: \(K(\boldsymbol{x},\boldsymbol{y})=\boldsymbol{x}^T\boldsymbol{y}\),
Polynomial: \(K(\boldsymbol{x},\boldsymbol{y})=(\boldsymbol{x}^T\boldsymbol{y}+\gamma)^d\),
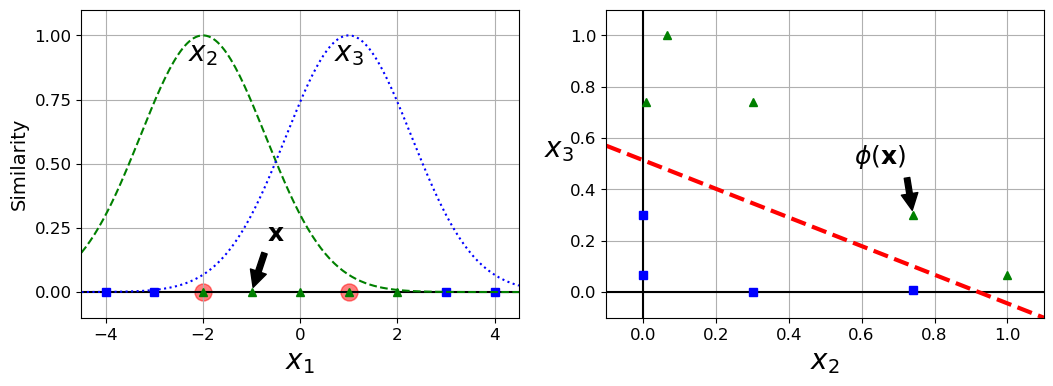
Gaussian Radial Basis Function: \(K(\boldsymbol{x},\boldsymbol{y})=\exp{\left(-\gamma\vert\vert\boldsymbol{x}-\boldsymbol{y}\vert\vert^2\right)}\),
Tanh: \(K(\boldsymbol{x},\boldsymbol{y})=\tanh{(\boldsymbol{x}^T\boldsymbol{y}+\gamma)}\),
and many other ones.
An important theorem for us is Mercer’s theorem. The theorem states that if a kernel function \(K\) is symmetric, continuous and leads to a positive semi-definite matrix \(\boldsymbol{P}\) then there exists a function \(\phi\) that maps \(\boldsymbol{x}_i\) and \(\boldsymbol{x}_j\) into another space (possibly with much higher dimensions) such that
So you can use \(K\) as a kernel since you know \(\phi\) exists, even if you don’t know what \(\phi\) is.
Note that some frequently used kernels (such as the Sigmoid kernel) don’t respect all of Mercer’s conditions, yet they generally work well in practice.
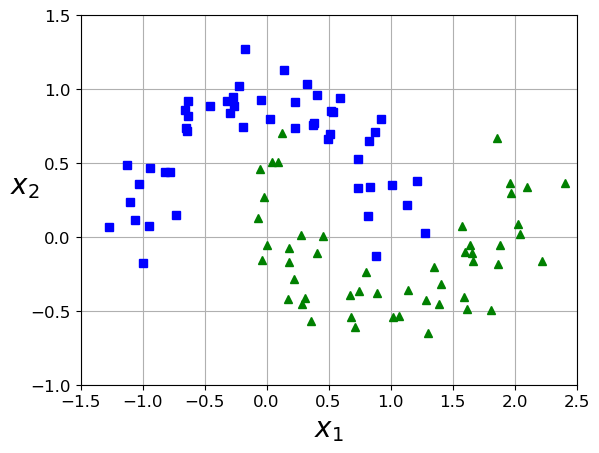
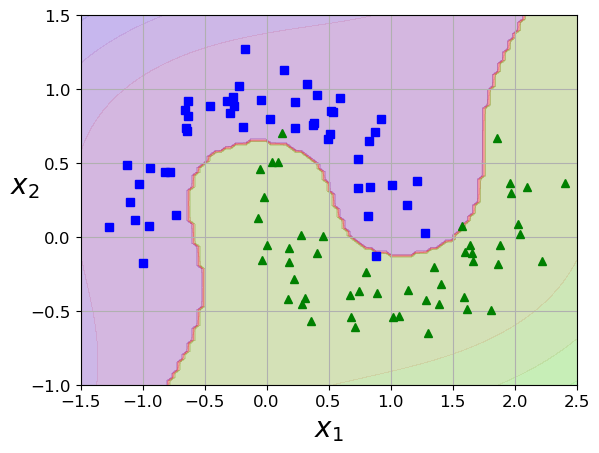
12.8. The moons example
from __future__ import division, print_function, unicode_literals
import numpy as np
np.random.seed(42)
import matplotlib
import matplotlib.pyplot as plt
plt.rcParams['axes.labelsize'] = 14
plt.rcParams['xtick.labelsize'] = 12
plt.rcParams['ytick.labelsize'] = 12
from sklearn.svm import SVC
from sklearn import datasets
from sklearn.pipeline import Pipeline
from sklearn.preprocessing import StandardScaler
from sklearn.svm import LinearSVC
from sklearn.datasets import make_moons
X, y = make_moons(n_samples=100, noise=0.15, random_state=42)
def plot_dataset(X, y, axes):
plt.plot(X[:, 0][y==0], X[:, 1][y==0], "bs")
plt.plot(X[:, 0][y==1], X[:, 1][y==1], "g^")
plt.axis(axes)
plt.grid(True, which='both')
plt.xlabel(r"$x_1$", fontsize=20)
plt.ylabel(r"$x_2$", fontsize=20, rotation=0)
plot_dataset(X, y, [-1.5, 2.5, -1, 1.5])
plt.show()
from sklearn.datasets import make_moons
from sklearn.pipeline import Pipeline
from sklearn.preprocessing import PolynomialFeatures
polynomial_svm_clf = Pipeline([
("poly_features", PolynomialFeatures(degree=3)),
("scaler", StandardScaler()),
("svm_clf", LinearSVC(C=10, loss="hinge", random_state=42))
])
polynomial_svm_clf.fit(X, y)
def plot_predictions(clf, axes):
x0s = np.linspace(axes[0], axes[1], 100)
x1s = np.linspace(axes[2], axes[3], 100)
x0, x1 = np.meshgrid(x0s, x1s)
X = np.c_[x0.ravel(), x1.ravel()]
y_pred = clf.predict(X).reshape(x0.shape)
y_decision = clf.decision_function(X).reshape(x0.shape)
plt.contourf(x0, x1, y_pred, cmap=plt.cm.brg, alpha=0.2)
plt.contourf(x0, x1, y_decision, cmap=plt.cm.brg, alpha=0.1)
plot_predictions(polynomial_svm_clf, [-1.5, 2.5, -1, 1.5])
plot_dataset(X, y, [-1.5, 2.5, -1, 1.5])
plt.show()
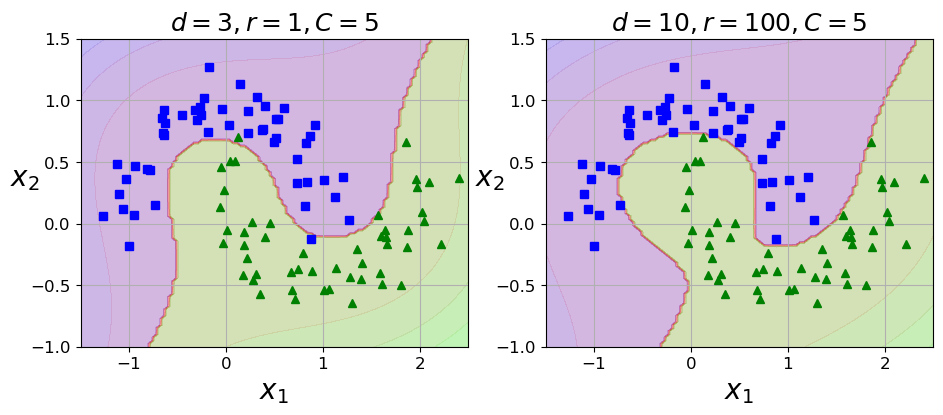
from sklearn.svm import SVC
poly_kernel_svm_clf = Pipeline([
("scaler", StandardScaler()),
("svm_clf", SVC(kernel="poly", degree=3, coef0=1, C=5))
])
poly_kernel_svm_clf.fit(X, y)
poly100_kernel_svm_clf = Pipeline([
("scaler", StandardScaler()),
("svm_clf", SVC(kernel="poly", degree=10, coef0=100, C=5))
])
poly100_kernel_svm_clf.fit(X, y)
plt.figure(figsize=(11, 4))
plt.subplot(121)
plot_predictions(poly_kernel_svm_clf, [-1.5, 2.5, -1, 1.5])
plot_dataset(X, y, [-1.5, 2.5, -1, 1.5])
plt.title(r"$d=3, r=1, C=5$", fontsize=18)
plt.subplot(122)
plot_predictions(poly100_kernel_svm_clf, [-1.5, 2.5, -1, 1.5])
plot_dataset(X, y, [-1.5, 2.5, -1, 1.5])
plt.title(r"$d=10, r=100, C=5$", fontsize=18)
plt.show()
def gaussian_rbf(x, landmark, gamma):
return np.exp(-gamma * np.linalg.norm(x - landmark, axis=1)**2)
gamma = 0.3
x1s = np.linspace(-4.5, 4.5, 200).reshape(-1, 1)
x2s = gaussian_rbf(x1s, -2, gamma)
x3s = gaussian_rbf(x1s, 1, gamma)
XK = np.c_[gaussian_rbf(X1D, -2, gamma), gaussian_rbf(X1D, 1, gamma)]
yk = np.array([0, 0, 1, 1, 1, 1, 1, 0, 0])
plt.figure(figsize=(11, 4))
plt.subplot(121)
plt.grid(True, which='both')
plt.axhline(y=0, color='k')
plt.scatter(x=[-2, 1], y=[0, 0], s=150, alpha=0.5, c="red")
plt.plot(X1D[:, 0][yk==0], np.zeros(4), "bs")
plt.plot(X1D[:, 0][yk==1], np.zeros(5), "g^")
plt.plot(x1s, x2s, "g--")
plt.plot(x1s, x3s, "b:")
plt.gca().get_yaxis().set_ticks([0, 0.25, 0.5, 0.75, 1])
plt.xlabel(r"$x_1$", fontsize=20)
plt.ylabel(r"Similarity", fontsize=14)
plt.annotate(r'$\mathbf{x}$',
xy=(X1D[3, 0], 0),
xytext=(-0.5, 0.20),
ha="center",
arrowprops=dict(facecolor='black', shrink=0.1),
fontsize=18,
)
plt.text(-2, 0.9, "$x_2$", ha="center", fontsize=20)
plt.text(1, 0.9, "$x_3$", ha="center", fontsize=20)
plt.axis([-4.5, 4.5, -0.1, 1.1])
plt.subplot(122)
plt.grid(True, which='both')
plt.axhline(y=0, color='k')
plt.axvline(x=0, color='k')
plt.plot(XK[:, 0][yk==0], XK[:, 1][yk==0], "bs")
plt.plot(XK[:, 0][yk==1], XK[:, 1][yk==1], "g^")
plt.xlabel(r"$x_2$", fontsize=20)
plt.ylabel(r"$x_3$ ", fontsize=20, rotation=0)
plt.annotate(r'$\phi\left(\mathbf{x}\right)$',
xy=(XK[3, 0], XK[3, 1]),
xytext=(0.65, 0.50),
ha="center",
arrowprops=dict(facecolor='black', shrink=0.1),
fontsize=18,
)
plt.plot([-0.1, 1.1], [0.57, -0.1], "r--", linewidth=3)
plt.axis([-0.1, 1.1, -0.1, 1.1])
plt.subplots_adjust(right=1)
plt.show()
x1_example = X1D[3, 0]
for landmark in (-2, 1):
k = gaussian_rbf(np.array([[x1_example]]), np.array([[landmark]]), gamma)
print("Phi({}, {}) = {}".format(x1_example, landmark, k))
rbf_kernel_svm_clf = Pipeline([
("scaler", StandardScaler()),
("svm_clf", SVC(kernel="rbf", gamma=5, C=0.001))
])
rbf_kernel_svm_clf.fit(X, y)
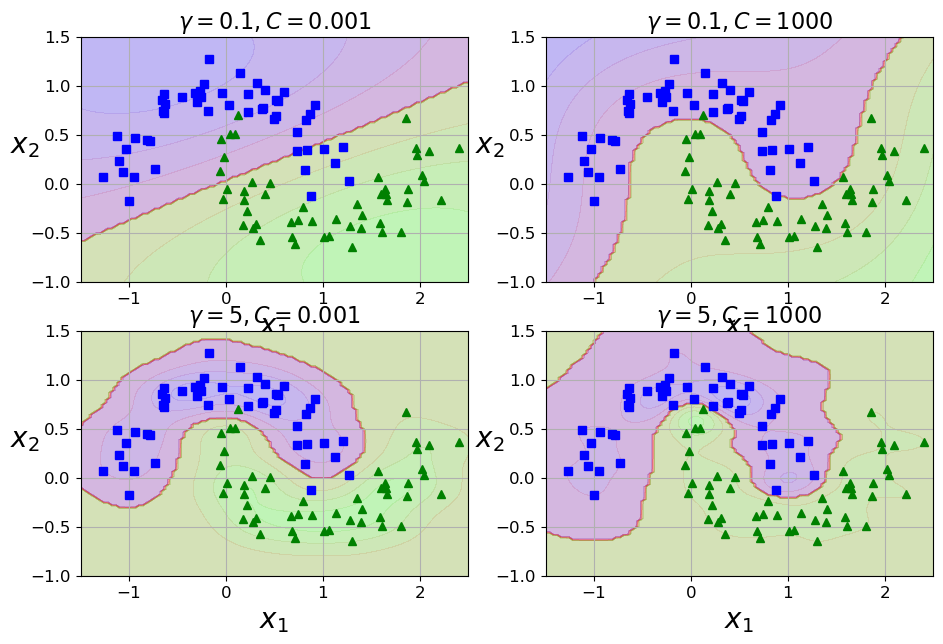
from sklearn.svm import SVC
gamma1, gamma2 = 0.1, 5
C1, C2 = 0.001, 1000
hyperparams = (gamma1, C1), (gamma1, C2), (gamma2, C1), (gamma2, C2)
svm_clfs = []
for gamma, C in hyperparams:
rbf_kernel_svm_clf = Pipeline([
("scaler", StandardScaler()),
("svm_clf", SVC(kernel="rbf", gamma=gamma, C=C))
])
rbf_kernel_svm_clf.fit(X, y)
svm_clfs.append(rbf_kernel_svm_clf)
plt.figure(figsize=(11, 7))
for i, svm_clf in enumerate(svm_clfs):
plt.subplot(221 + i)
plot_predictions(svm_clf, [-1.5, 2.5, -1, 1.5])
plot_dataset(X, y, [-1.5, 2.5, -1, 1.5])
gamma, C = hyperparams[i]
plt.title(r"$\gamma = {}, C = {}$".format(gamma, C), fontsize=16)
plt.show()
/Users/mhjensen/miniforge3/envs/myenv/lib/python3.9/site-packages/sklearn/svm/_base.py:1206: ConvergenceWarning: Liblinear failed to converge, increase the number of iterations.
  warnings.warn(
Phi(-1.0, -2) = [0.74081822]
Phi(-1.0, 1) = [0.30119421]
12.9. Mathematical optimization of convex functions
A mathematical (quadratic) optimization problem, or just optimization problem, has the form
subject to some constraints for say a selected set \(i=1,2,\dots, n\). In our case we are optimizing with respect to the Lagrangian multipliers \(\lambda_i\), and the vector \(\boldsymbol{\lambda}=[\lambda_1, \lambda_2,\dots, \lambda_n]\) is the optimization variable we are dealing with.
In our case we are particularly interested in a class of optimization problems called convex optmization problems. In our discussion on gradient descent methods we discussed at length the definition of a convex function.
Convex optimization problems play a central role in applied mathematics and we recommend strongly Boyd and Vandenberghe’s text on the topics.
If we use Python as programming language and wish to venture beyond scikit-learn, tensorflow and similar software which makes our lives so much easier, we need to dive into the wonderful world of quadratic programming. We can, if we wish, solve the minimization problem using say standard gradient methods or conjugate gradient methods. However, these methods tend to exhibit a rather slow converge. So, welcome to the promised land of quadratic programming.
The functions we need are contained in the quadratic programming package CVXOPT and we need to import it together with numpy as
import numpy
import cvxopt
This will make our life much easier. You don’t need t write your own optimizer.
We remind ourselves about the general problem we want to solve
Let us show how to perform the optmization using a simple case. Assume we want to optimize the following problem
The minimization problem can be rewritten in terms of vectors and matrices as (with \(x\) and \(y\) being the unknowns)
Similarly, we can now set up the inequalities (we need to change \(\geq\) to \(\leq\) by multiplying with \(-1\) on bot sides) as the following matrix-vector equation
We have collapsed all the inequalities into a single matrix \(\boldsymbol{G}\). We see also that our matrix
is clearly positive semi-definite (all eigenvalues larger or equal zero). Finally, the vector \(\boldsymbol{h}\) is defined as
Since we don’t have any equalities the matrix \(\boldsymbol{A}\) is set to zero The following code solves the equations for us
# Import the necessary packages
import numpy
from cvxopt import matrix
from cvxopt import solvers
P = matrix(numpy.diag([1,0]), tc=’d’)
q = matrix(numpy.array([3,4]), tc=’d’)
G = matrix(numpy.array([[-1,0],[0,-1],[-1,-3],[2,5],[3,4]]), tc=’d’)
h = matrix(numpy.array([0,0,-15,100,80]), tc=’d’)
# Construct the QP, invoke solver
sol = solvers.qp(P,q,G,h)
# Extract optimal value and solution
sol[’x’]
sol[’primal objective’]
  Input In [5]
    P = matrix(numpy.diag([1,0]), tc=’d’)
                                     ^
SyntaxError: invalid character '’' (U+2019)
We are now ready to return to our setup of the optmization problem for a more realistic case. Introducing the slack parameter \(C\) we have
subject to \(\boldsymbol{y}^T\boldsymbol{\lambda}=0\). Here we defined the vectors \(\boldsymbol{\lambda} =[\lambda_1,\lambda_2,\dots,\lambda_n]\) and \(\boldsymbol{y}=[y_1,y_2,\dots,y_n]\). With the slack constants this leads to the additional constraint \(0\leq \lambda_i \leq C\).
code will be added